Bring Your T-Shirt Sales to Life
Help your audience visualise your KPIs.
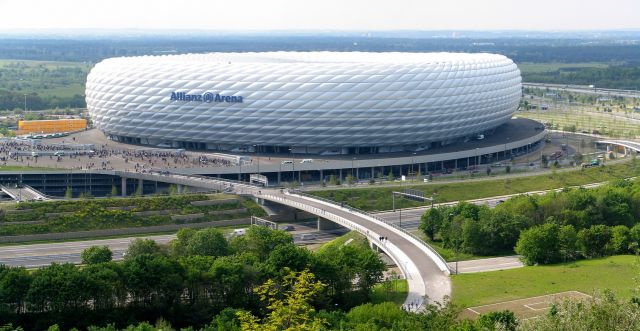
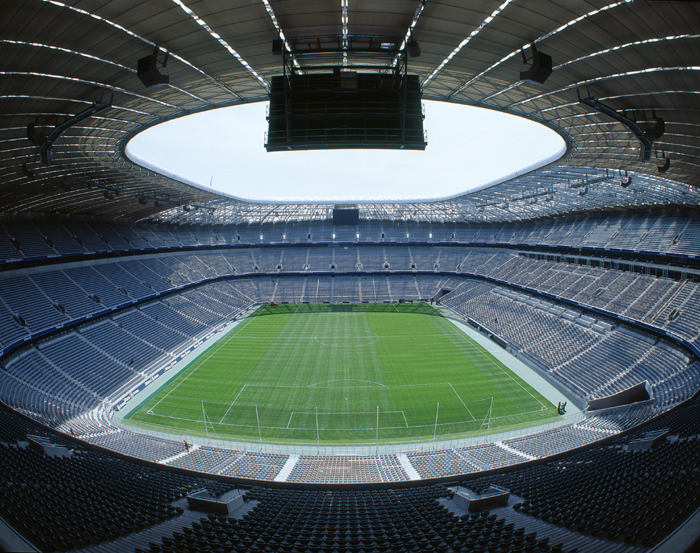
How much is 1.2 million T-shirts?
Imagine the Allianz Arena filled more than 18 times...
That's a lot of T-shirts!
That's a lot of T-shirts!
A gentleman I worked with at a leading sports brand wanted to highlight the number of graphic T-shirts his business unit was selling.
Rather than do the usual boring PowerPoint sales chart, he used
powerful imagery of the Allianz Arena to bring the sales figure,
one of his KPIs, to life.
powerful imagery of the Allianz Arena to bring the sales figure,
one of his KPIs, to life.
By placing this imagery at the beginning of his presentation, he captured the audiences imagination and was able to make a much more interesting and memorable KPI report.
He followed with the "standard" PowerPoint KPI charts, but the Allianz Arena slides gave the audience a great and unconventional way to put thsoe numbers in context.
He followed with the "standard" PowerPoint KPI charts, but the Allianz Arena slides gave the audience a great and unconventional way to put thsoe numbers in context.
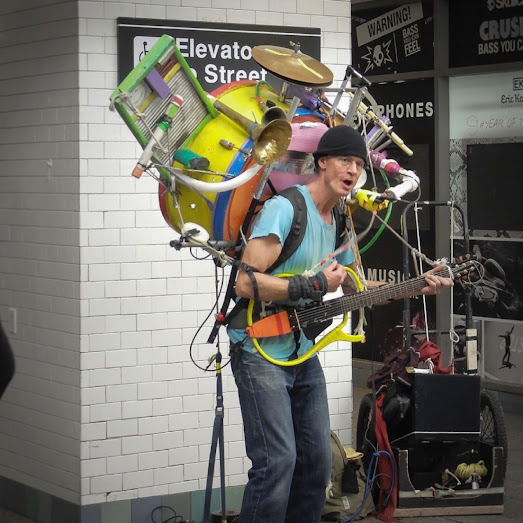
Don't be afraid to be creative. Don't be afraid to be different.
The only rule is that you must clearly link your imagery with your message.


Comments
Post a Comment